Use the Charts
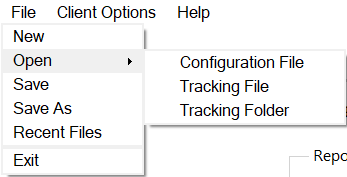
1.Click the Charts 2.In the top-left corner of the Intellek Deliver Manager window, click File. 3.Click Open.
4.Select: •Tracking File to select the tracking file for an individual learner. •Tracking Folder to select all learner results from a particular date or range of dates. 5. A file with the Learner’s name will be in the day sub-folder based on the date the associated content was accessed by the learner. For example:
The icons on the Tracking page, from left to right, are as follows:
•View the Raw Data in table form. •Refresh the data. •Print the displayed chart (see below). •Change the Tracking Folder Location. When the View the Raw Data icon is clicked, the icon bar changes to:
•Switch to Chart Tracking View. •Refresh the Data. •Export the data to a .csv file. •Change the Tracking Folder Location. |
The available choices to create reports are:
1.Select the Report Type.
2.Select the Report Style. 3.Options for selecting learners, dates, etc. are offered once you make these selections. |

