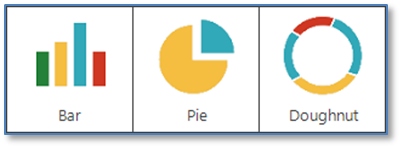
Live Content Studio provides the ability to create charts based on end-user results as a means of identifying strengths and weaknesses of both the user and the content.
There are four different types of charts that can be generated:

Additionally, for each chart type, there are three chart styles from which you can choose:

Once a chart has been generated, you can review additional data or print the chart. The specifics for each chart type are described the Related Topics listed.