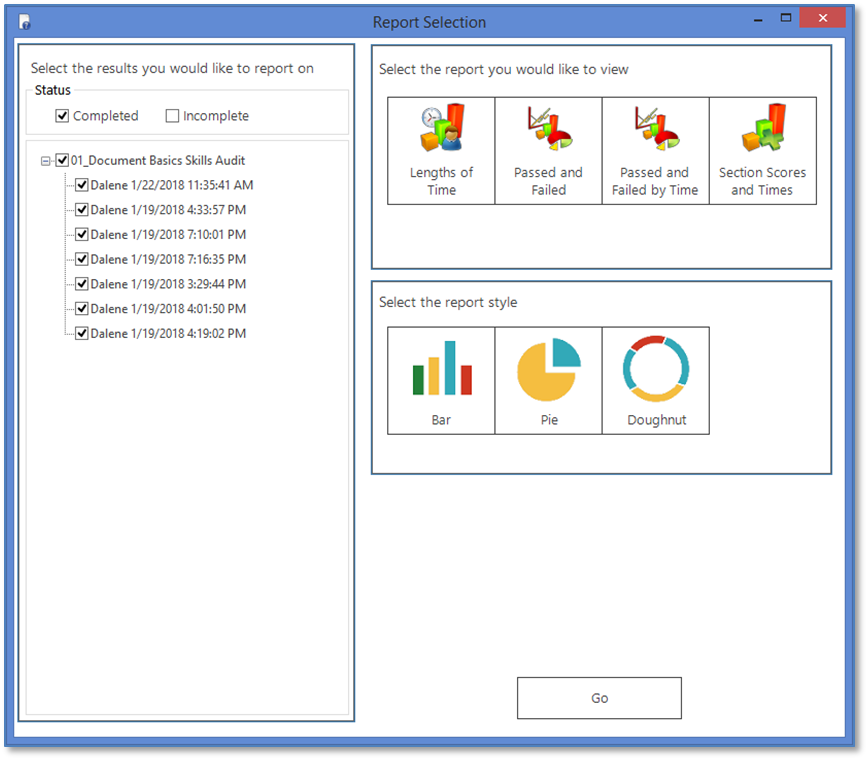
The basic steps to create Results Charts are the same, no matter which Chart Type and Style combination is selected. However, in order to create Results Charts, you must be in a Results file and at the User Summary (2nd) layer of the Results file.
1.Open a Results file.
2.From the Summary layer, click the blue arrow ![]() to display the User Summary layer of the Results File.
to display the User Summary layer of the Results File.
3.Click the Choose Reporting button on the ribbon.

4.In the Report Selection window:

The seven selected Completed end-user Results in the graphic above are used in the Chart Report topics.
a.In the left panel, select the appropriate User Status (i.e., Completed or Incomplete).
b.Select the check box(es) for the user result(s) you want included in the chart.
c.On the right, select the appropriate report.
d.Select the appropriate report style.
e.Depending on the report selected, additional options may display (see the individual Chart descriptions in the How to use the charts topic).
5.Click Go to generate and display the chart.