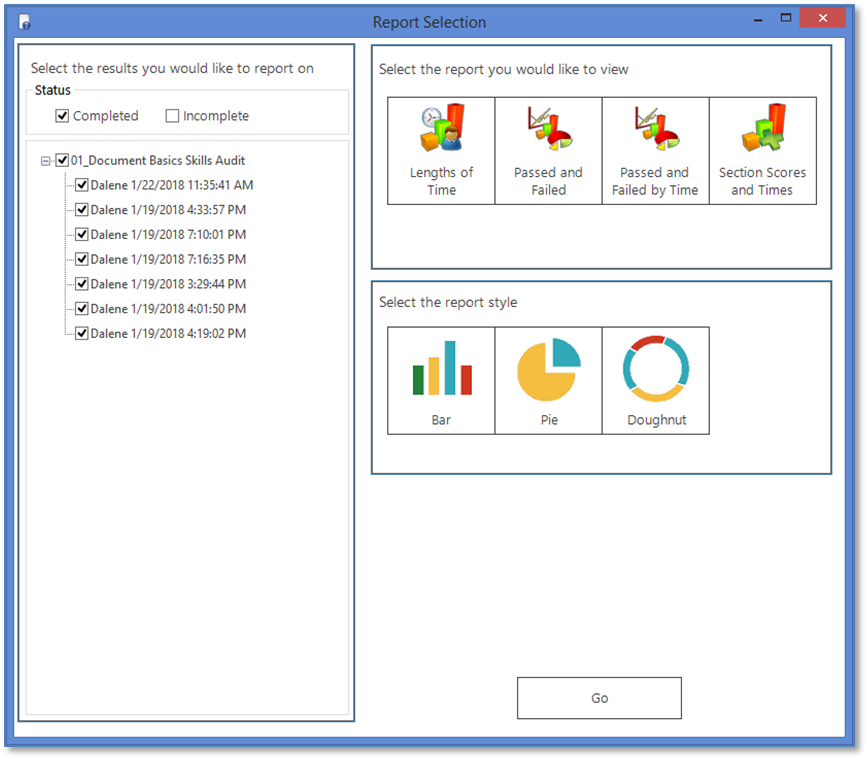
The Lengths of Time Chart provides a comparison of the length of time the selected end-users took to complete the assessment or test. When this Chart Type is selected, you will need to also select the time segments (intervals) by which you want to compare:

If you click the time segment of Other, you will need to enter the number of minutes to be used to create the chart segments.
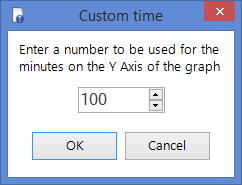
Using a 5-minute time segment for the seven Sample End-User Results, the Lengths of Time chart may display as follows when generated by clicking the Go button.
For example purposes, the seven selected Completed end-user results in the graphic below will be used in the chart examples that follow.
|
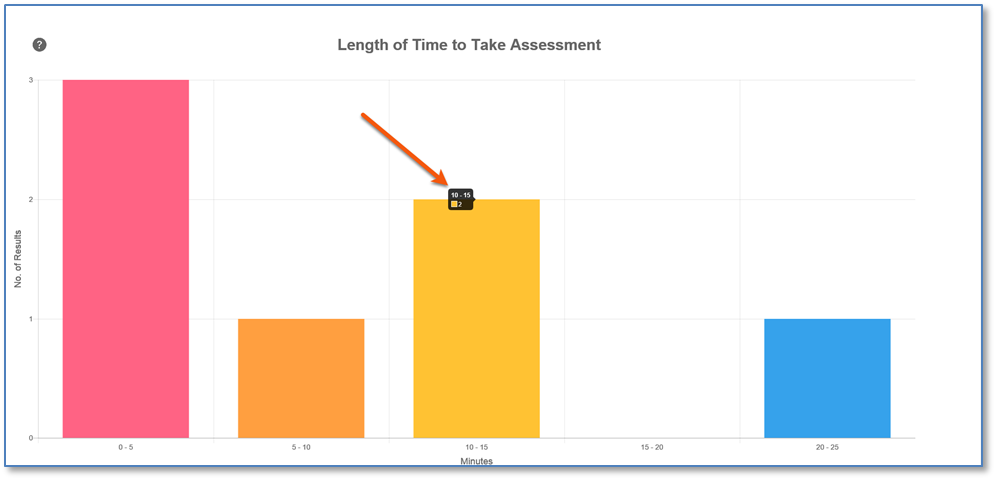 When you hover over any bar, a small label displays showing the time segment and number of end-users meeting the criteria. |
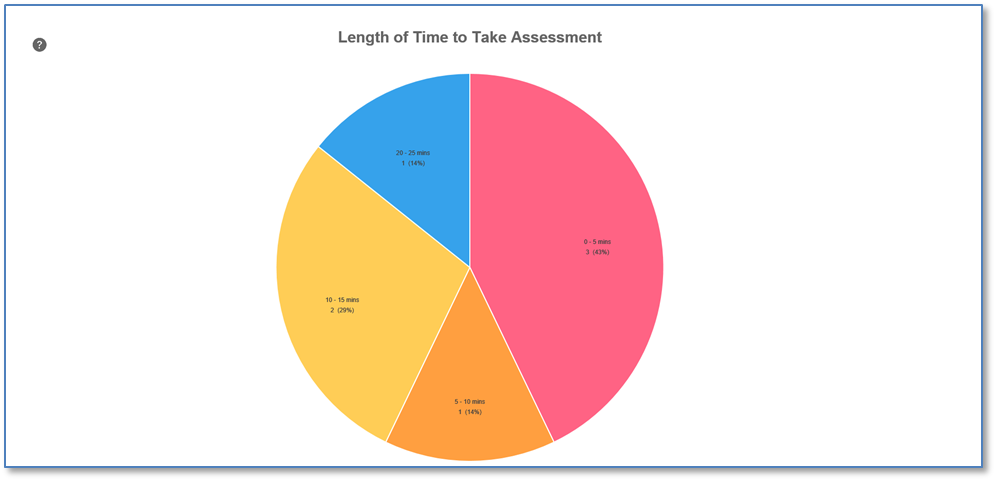 When you hover over any colored segment, labels show the time segment and number of end-users meeting the criteria. |
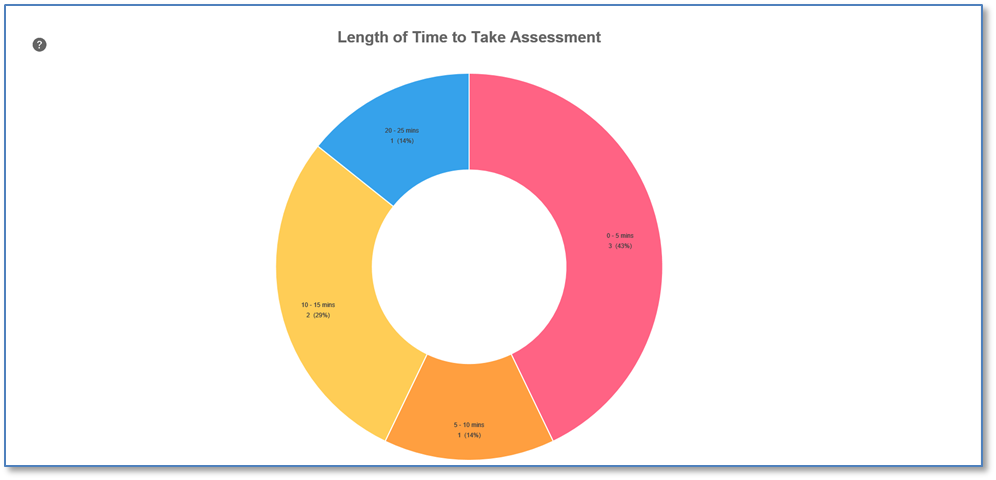 When you hover over any colored segment, labels show the time segment and number of end-users meeting the criteria. |
