This chart compares how many end-users passed vs. failed the assessment. For this report, you will need to enter the minimum passing percentage for the assessment:

![]() You will need to know what the originally published or packaged passing score was set to in the content. If the passing percentage score was set differently on the course in the LMS, you will need to enter that score instead.
You will need to know what the originally published or packaged passing score was set to in the content. If the passing percentage score was set differently on the course in the LMS, you will need to enter that score instead.
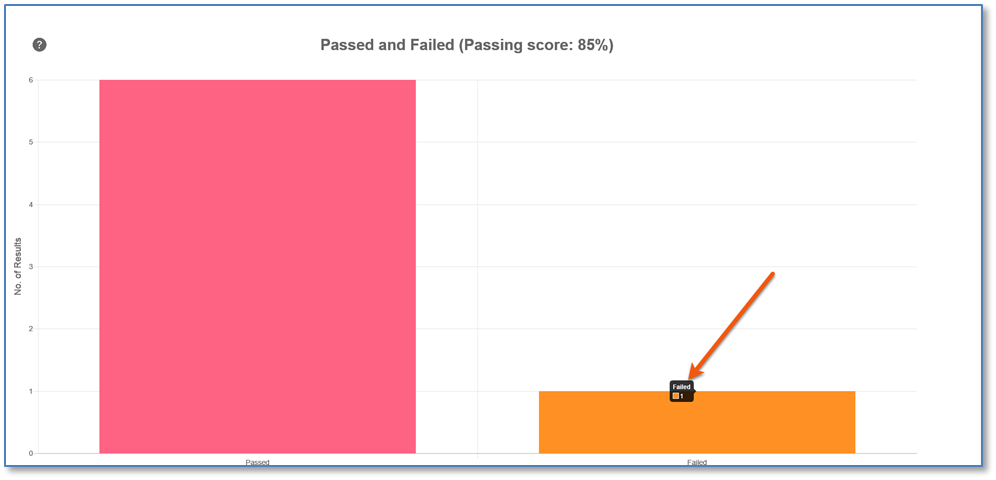
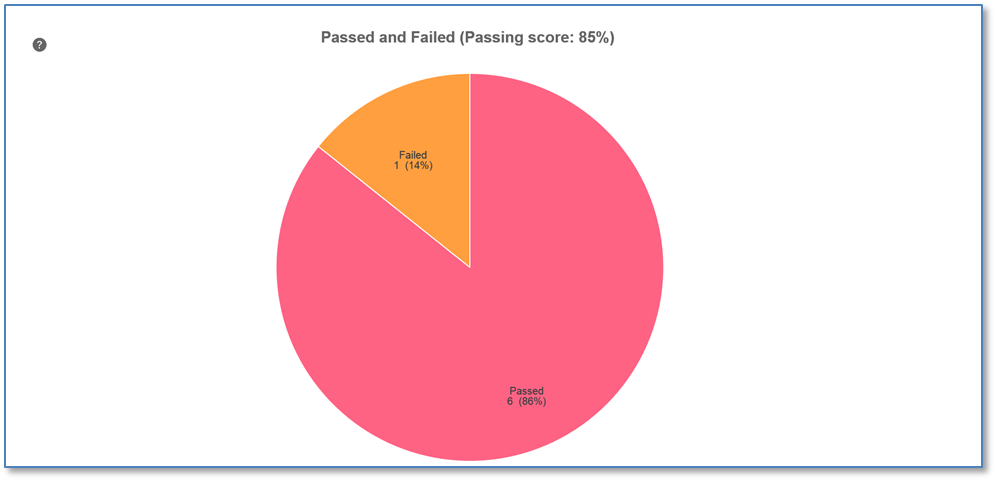
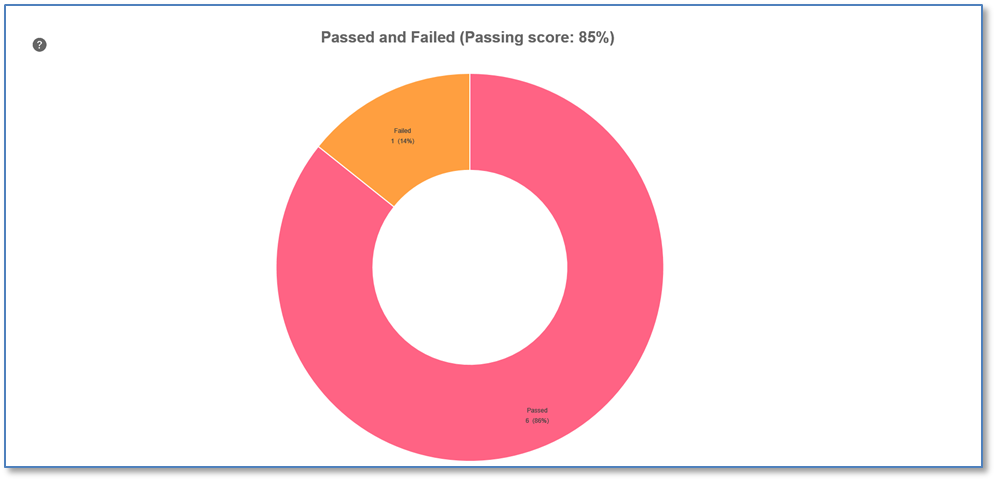
Using a Passing Score of 85% for the seven selected end-users, the Passed and Failed Report Charts may display as follows when generated by clicking the Go button.
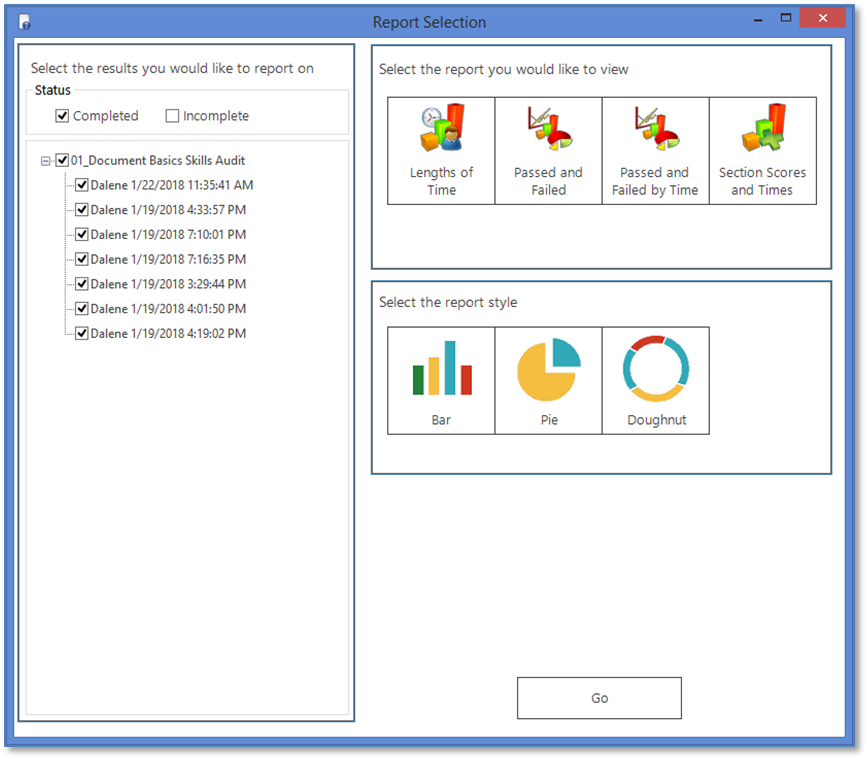
For example purposes, the seven selected Completed end-user results in the graphic below will be used in the chart examples that follow.
|
 When you hover over either bar, a small label displays showing the number of end-users meeting the criteria. |
 When you hover over any colored segment, labels show the time segment and number of end-users meeting the criteria. |
 When you hover over any colored segment, labels show the time segment and number of end-users meeting the criteria. |
