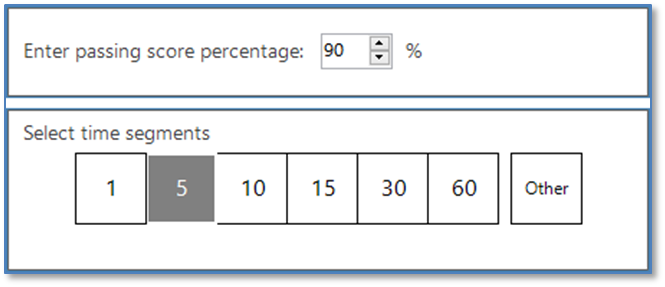
This report compares end-user results both by passing vs. failing AND amount of time taken to complete the assessment. When selected, this report requires that you set both the Passing Score percentage AND Time Segment values.

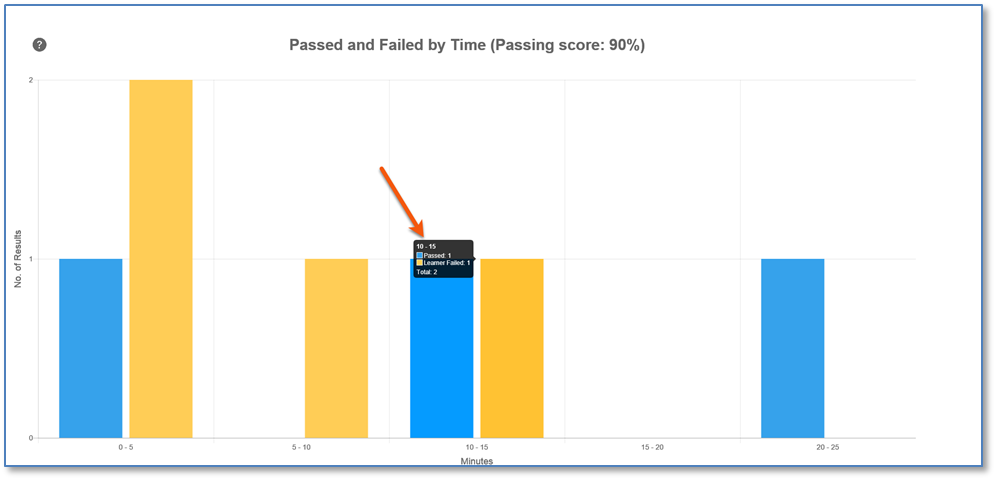
Using a Passing Score of 90% and 5-minute Time Segments as an example for the seven selected end-users, the Passed and Failed by Time Report Charts may display as follows when generated by clicking the Go button.
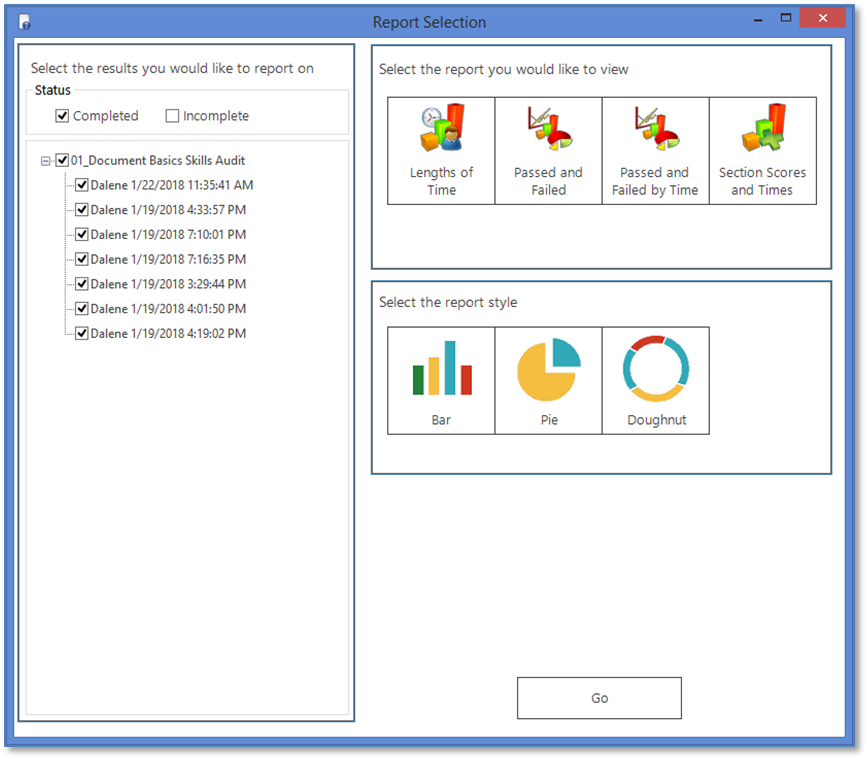
For example purposes, the seven selected Completed end-user results in the graphic below will be used in the chart examples that follow.
|
The Bar Chart Style is the only available style for this Report.

When you hover over any bar, a small label shows the number of end-users meeting (or not meeting) the criteria. In this report, blue bars represent passing users in the amount of time and the yellow bar represents failing users in that time range.
When you click on any bar, the filtered list includes a Pass/Fail column in the Summary layer, which can be sorted. Following the example, clicking on the yellow bar in the 0-5 minute time segment displays the following filtered list:

