To access the LMS analytics:
1.Navigate to the Analytics page.
2.The default view is the Dashboard.
![]() To view Survey Analytics, click the three dot Options menu, and then select Surveys.
To view Survey Analytics, click the three dot Options menu, and then select Surveys.
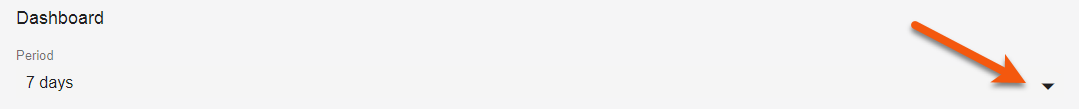
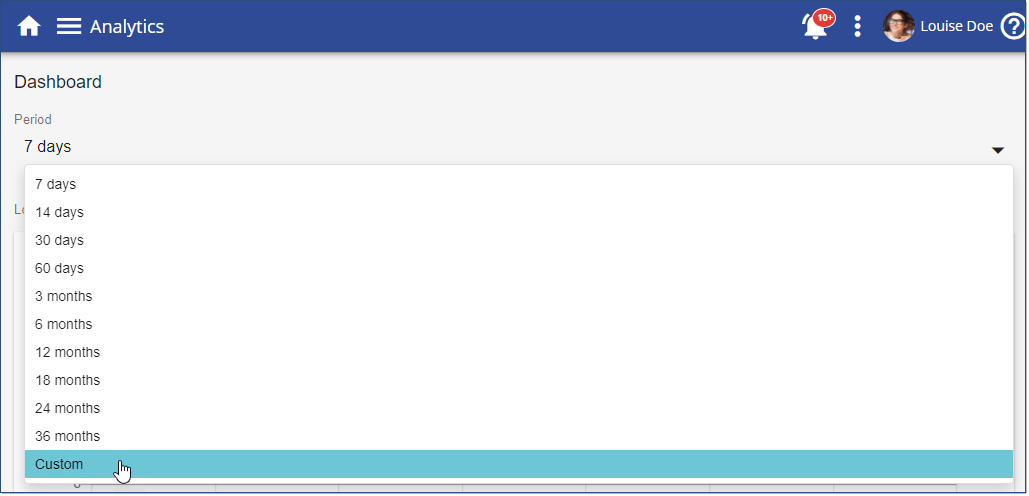
The Analytics Dashboard currently provides three sections. The Period arrow allows you to select various time spans, depending on how much data you want to see. Also included in the drop down options is a custom date range.
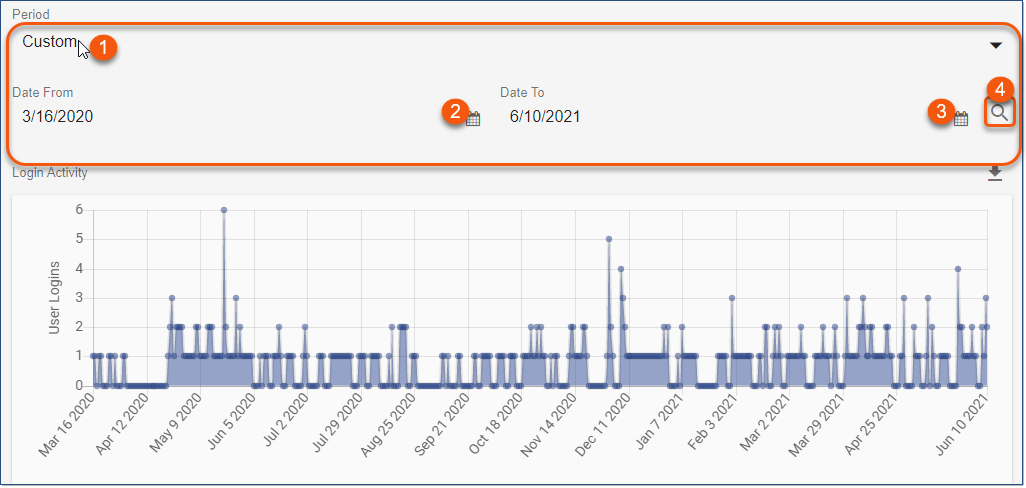
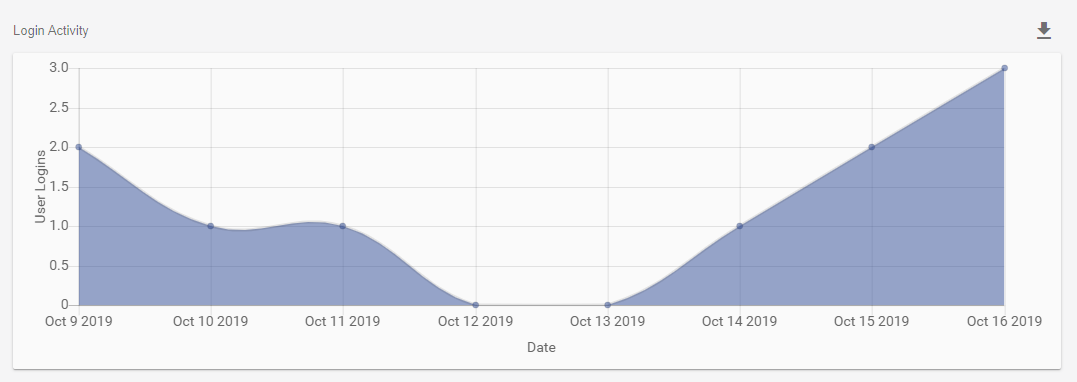
Login Activity
The Login Activity provides a graphical interface to show the logins recorded in the LMS. Click the Export ![]() icon to export the data to Excel.
icon to export the data to Excel.
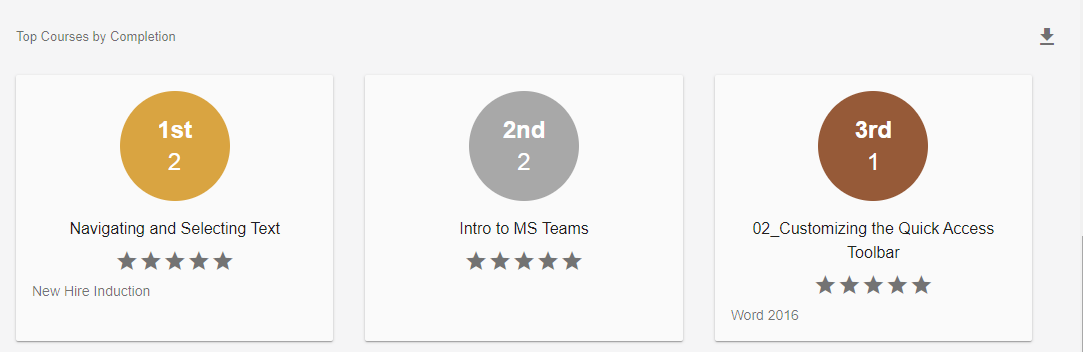
Top Courses by Completion
This chart is populated based on the number of users marked as Finished, Passed, or Failed on both Courses and Events. Click the Export ![]() icon to export the data to Excel.
icon to export the data to Excel.
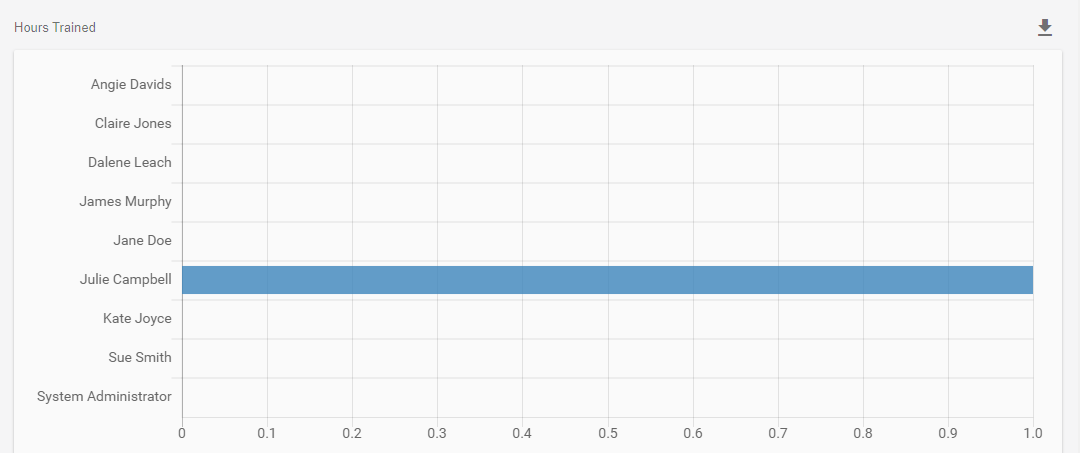
Hours Trained
Easily see how many hours have been trained by the Event Contacts you have in the LMS. Click the Export ![]() icon to export the data to Excel.
icon to export the data to Excel.