A detailed, click-by-click Results Report for the end-user can be displayed at the end of an assessment, similar to the detailed results displayed in the Manager tool. To provide this capability to end-users, the Results button must be enabled on the last Instruction or a Score Sheet(s) from the Options tab in the Add/Edit Instruction window.
![]() This button is turned OFF by default. For existing assessments, in order for end-users to see their own results, you would need to turn on the button and then republish.
This button is turned OFF by default. For existing assessments, in order for end-users to see their own results, you would need to turn on the button and then republish.
When allowing end-users to view their click-by-click Results, you have the option of adding Associated Learning Links for end-users to access related learning resources from an LMS, SharePoint, shared network drive, or web page.
To break up an assessment for sub-total scoring and results viewing, you can add Section markers to an Instruction from the Flow tab in the Add/Edit Instruction window. Before adding Section markers, we recommend you create Section Heading Instructions which contain no captured steps with unique formatting (e.g., with a different Back color on the Theme tab, and centered Text) for the purpose of introducing a new section. Section sub-totals are visible to managers in the Results and as an option for end-users.
The Results tab of the Main Interface has two options that can be activated which impact the way end-user results can be viewed by both end-user and manager. Both options are turned OFF by default.
Activating User Results in the Add/Edit Instruction Window
From the Add/Edit Instruction window, consider activating one or more of these options:
•Enabling the click-by-click Results Report for end-users.
•Section Heading Instructions with Section markers (if using sub-totals in the Results).
•Adding Score sheets to display a total score (percentage) to end-users immediately upon completion of the content.
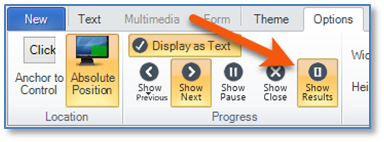
1.Select either the Closing (last) Instruction or a Score Sheet. 2.If necessary, click the Options tab. 3.In the Progress group on the ribbon, click (turn on) the Show Results button.
|
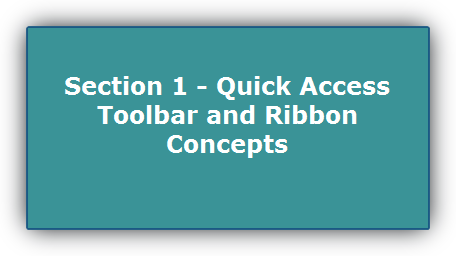
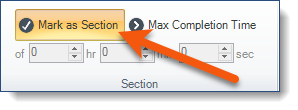
To break up an assessment into Sections for sub-total scoring and results viewing: 1.Create a separate Instruction that includes the Section Number and Heading, as appropriate at the start of each Section.
2.OPTIONAL: Click the Theme tab, and then change the Back Color of the Instruction (then consequently, the Text color for the heading). For example:
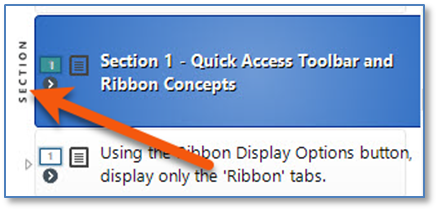
3.Click the Flow tab. a.Click the Mark as Section button in the Section group on the ribbon.
b.In the Instruction Panel, the Section marker is displayed to the left of the Instruction:
3.OPTIONAL: Click the Associated Learning tab to assign learning resources to relevant Instructions.
4.OPTIONAL: Click the Options tab. Consider setting the Instruction Location to the Center of the screen, and then set the Width and Height appropriately. |
Activating User Results from the Main Interface
From the Main Interface, you can add Score sheets to display a total score (percentage) to end-users immediately upon completion of the content.
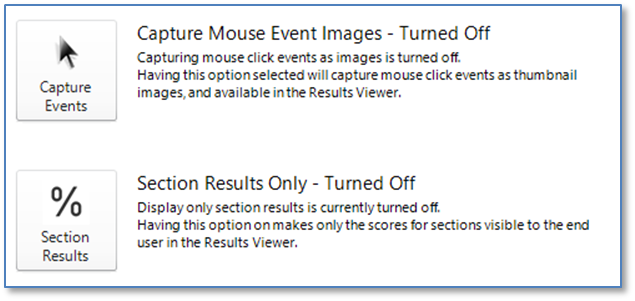
•Capturing Mouse Event Images.
•Decide whether to display only the Section sub-totals and total score to end-users or the complete click-by-click Results.
The Results tab of the Main Interface has two options that can be activated which impact the way end-user results can be viewed by both end-user and manager. Both options are turned OFF by default.
•Capture Mouse Event Images – captures and creates a thumbnail screen shot of where and what the end-user clicked for each step performed. In Results files, click the •Section Results Only – controls the level of information end-users can view in their results. Provided that Section markers have been applied to Section heading Instructions (see Step 3 under Creating Section Heading Instructions), the end-user will only see their pass/fail percentage for each Section of the assessment. See sample images under How End-Users View Their Results (full click-by-click Results) or How End-Users View Their Section Only Results (Section Results Only).
|
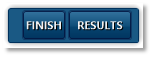
Once the end-user reaches the Closing (last) Instruction or Score Sheet, the Results button will display on the Content Navigation toolbar.
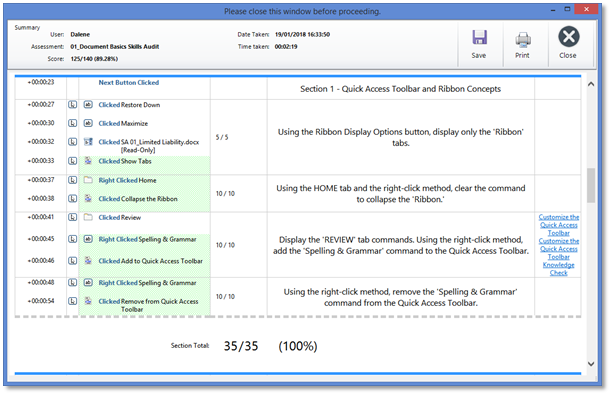
When the end-user clicks the Results button, the Section Results Report (read-only) is displayed:
•From left to right, the columns represent: oTimestamp of end-user actions through the content. oIf Capture Mouse Event Images was active when the content was published, the oAction Performed – this column displays the click-by-click actions performed by the end-user. Green highlighted actions indicate a correctly performed action. Red highlighted actions indicate an incorrectly performed action. oScore – Points awarded to the end-user for the performed step (if a score was applied). oInstruction – The Instruction displayed to the end-user. oAssociated Learning – If one or more Associated Learning Links were applied to an Instruction, the links will display in the last column. Clicking on a link will launch the associated content. •The page is read-only. •The screen can be maximized. •The user can print using the Print button or by pressing Ctrl+P.
•The user can save the report to an .html file by using the Save button.
•This screen must be closed before the user can proceed. •The screen can be closed with the Close button, the window X, or the ESCape key. |